Your Observability Dashboard Is Throttling the Agent It Watches — an Async Latency Postmortem

PERF DEEP DIVE. This is an engineering deep dive, not a methodology overview — how one synchronous call periodically stalled every concurrent request on a single-threaded event loop inside an enterprise customer-service Agent, and how I traced it from "first suspect: ES" all the way to the real culprit, "the ops dashboard itself." The upper-layer methodology — how to test AI systems, which metric to chase — lives in the Agentic AI in Practice series. This post and the previous one — Your KB Changed, the Search Index Didn't — belong to the engineering-postmortem sub-series. 中文版:CPU 没满、QPS 没涨,P99 却翻倍——是运维看板在偷偷掐住客服 Agent.
The opening: a P99 spike that arrives every few minutes on schedule
I was looking at the customer-service Agent's latency curve and saw a shape that didn't sit right.
P99 wasn't high — it was rhythmic. Most of the time it sat obediently below the target line (p95_target_s=5.0, hard-coded in the dashboard), 2 to 3 seconds a round, clean. Then every few minutes — snap — a spike into double-digit seconds, then back down. A few minutes later, another.
P99 latency (s)
 12 ┤        ╮              ╮              ╮
  9 ┤        │              │              │
  6 ┤── ─ ── │ ── ── ── ── ─│ ── ── ── ── ─│ ── ─  ← p95_target 5s
  3 ┤────────╯──────────────╯──────────────╯───────
    └────────────────────────────────────────────
         ▲ a precise spike every few minutes
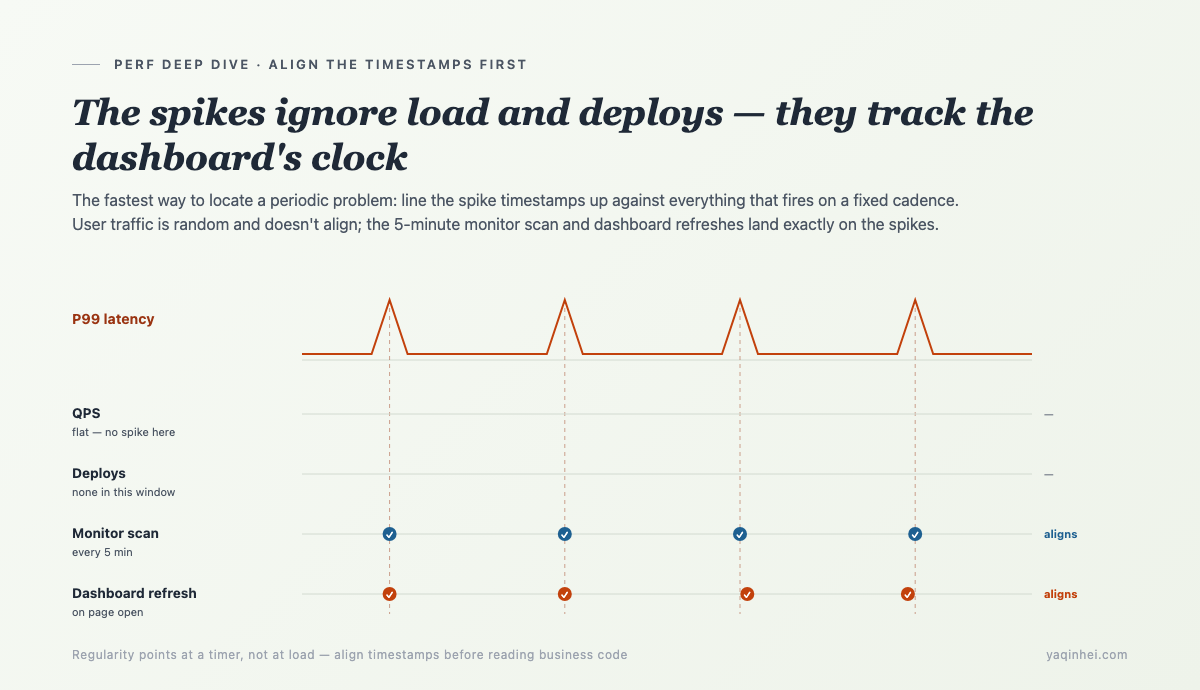
Random slowness doesn't scare me — network jitter, a query hitting a big document, the model occasionally lagging, all normal. But periodic slowness means something behind it fires on a fixed beat, and each firing drags latency up once. That regularity is itself the clue: it's not "load went up," it's "something goes off on a timer."
So I pulled up every "metric you'd normally check" and went down the list:
- CPU: flat. Not tracking the spikes.
- QPS: flat. No surge of incoming requests at the spike instant.
- Error rate: zero. No 500s, no timeout errors.
- Agent code: not a single line changed those days. No new deploy.
Load unchanged, code unchanged, machine not breathing hard — yet latency periodically doubles. That combination rules out every "can't keep up" explanation. The Agent isn't doing more work or heavier work; something is pinning it down for a few seconds at a time, on a schedule.
So — who's doing the pinning? My first instinct, and everyone's in the room, was the same: retrieval.
Why the first suspect is always ES, and why this time it was innocent
The heaviest I/O a customer-service Agent does is knowledge-base retrieval, so the moment latency twitches, every finger points at ES first. That's the right instinct — it just pointed wrong this time.
The reasoning is plain: in one conversation, calling an order API is milliseconds, running intent classification is local; the only slow, heavy step is a BM25 + vector hybrid recall against Elasticsearch. Empirically, latency problems live there nine times out of ten. So I went to read the retrieval layer, expecting to catch a synchronous blocking ES call red-handed.
The retrieval layer was clean. The ES query is async:
# app/retrieval/elasticsearch.py
_bm25_t0 = time.perf_counter()
response = await self._es.search(index=INDEX_NAME, body=body)
bm25_hits = response["hits"]["hits"]
logger.info("retrieval[ES BM25]: count=%d latency=%.1fms", len(bm25_hits), _lat_ms(_bm25_t0))

# hybrid retrieval: embedding is async too
if self._embedding:
    vector = await self._embedding.embed(query)
It uses the AsyncElasticsearch client, await-ed out; embedding goes through AsyncOpenAI, also await-ed out. The two most suspicious network calls are not blocking on the event loop.
And the killer detail is that logger.info line — the BM25 latency it prints at the spike instant looks no different from normal, a few dozen milliseconds. If ES were slow, that number would climb with the spike. It didn't.
# retrieval logs during a spike — clean
retrieval[ES BM25]: count=5 latency=42.7ms
retrieval[ES BM25]: count=5 latency=39.1ms   ← end-to-end P99 this second is 11s
retrieval[ES BM25]: count=5 latency=44.3ms
Retrieval is 40 ms, while this second's end-to-end P99 is 11 seconds. Those 10-plus seconds aren't in retrieval — they're somewhere before the request even reaches retrieval. ES is cleared.
That step saved me a pile of time downstream, not because I'm clever but because the most effective move with this class of problem isn't guessing what broke — it's confirming, segment by segment along the data flow, what's still correct: retrieval correct, embedding correct, retrieval-latency log correct — so the slow part can only be upstream of those "correct" segments, or in the gaps between them.
But what could be in the gaps? Request arrives, parse, classify, retrieve… every segment is the Agent's own code, none slow. The thing is, in a single-threaded async service, what slows you down need not be any segment on your request path at all.
The single-threaded event loop: one sync call, everybody queues
asyncio is single-threaded cooperative scheduling — only one piece of Python runs on the event loop at any instant. Which means: any one synchronous call that doesn't yield control freezes every concurrent request on the loop at that instant, even ones it has nothing to do with.
This is the whole key to the incident, worth three sentences.
Why is concurrency possible normally? Because every request, on hitting I/O (querying ES, calling an API, waiting on the model), does an await, handing control back to the loop, which uses the gap to advance other requests. Everyone takes turns yielding, and it looks like they run at once. The premise of this whole mechanism is: everyone dutifully yields at I/O.
Once one piece of code doesn't yield — typically a synchronous network call, which during the few seconds it waits for the HTTP response neither awaits nor returns control, just clutches the loop — then for those seconds, all other requests on the loop freeze, waiting behind it.
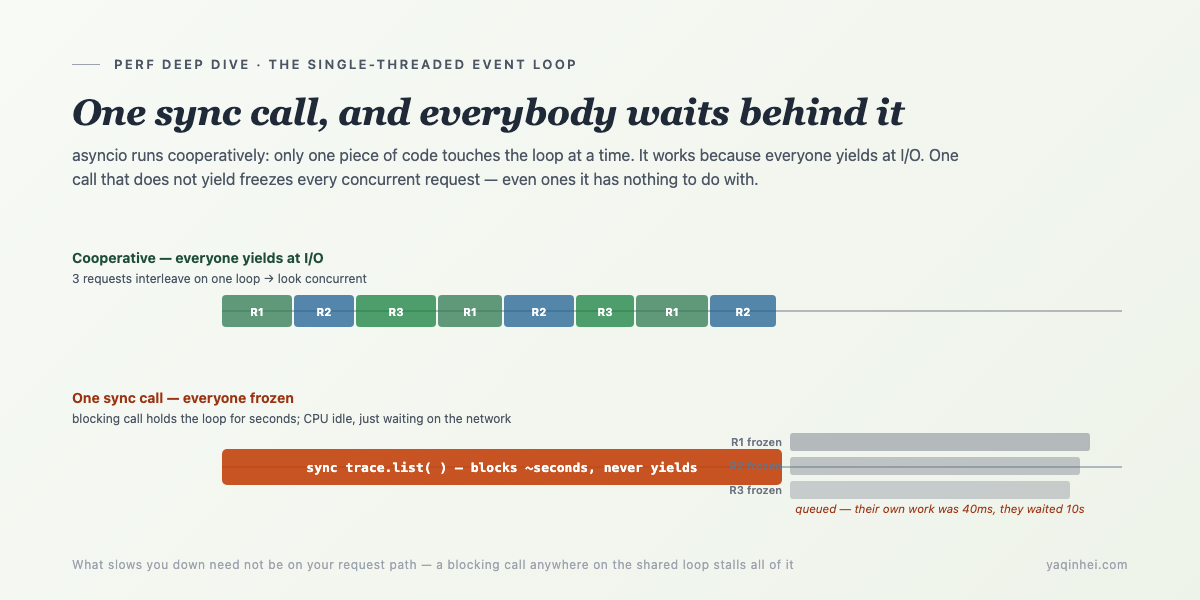
Applied here: during that spike second, the live customer requests that got stuck had retrieval of only 40 ms each. They're slow not because they themselves are slow, but because someone else is clutching the loop, and they queued outside the door for 10 seconds.
So what I needed to find next wasn't "which request path is slow," but "who, on that fixed beat, threw a synchronous blocking call onto this shared loop." And the fact that it has a rhythm tells me: it's probably not user-triggered (users arrive randomly) but some scheduled task.
Catching it in the act: align spikes to "non-user-triggered" events
The most direct move for a periodic problem is to align timestamps: put the spike instants side by side with everything that fires on a fixed interval, and see whose beat matches.
There aren't many things in the service running on a fixed interval. I listed them and matched beats one by one. The fastest match was the background monitor scan:
# app/monitor/scheduler.py
async def run_monitor_loop(scanner: Scanner, interval_seconds: int = 300) -> None:
    """Background loop: scan every `interval_seconds` (default 5 min)."""
    while True:
        try:
            count = await scanner.scan()
            ...
        await asyncio.sleep(interval_seconds)   # default 300s = 5 minutes
interval_seconds=300 — every 5 minutes. The spike's beat matched it.
Note how that background loop runs: it's an async def, sleeping with asyncio.sleep, running on the same event loop as the FastAPI main service. It's not another process, not another thread — it shares the one single-threaded loop with live customer requests. Hold that thought; it's the physical basis for everything that follows.
But scanner.scan() is itself await-ed, so it appears to yield. "Monitor runs every 5 minutes" alone isn't enough to convict — you have to see what it actually calls while it runs. Besides this 5-minute background scan, there was a trigger I missed at first: the ops dashboard page. Every time someone opens it, the frontend pulls a batch of KPIs, recent sessions, latency distribution — and all of that comes from the same place.
Following the monitor scan and the dashboard fetch inward, both converge on one module: the rollup that aggregates Langfuse traces into dashboard KPIs. The culprit is there.
The culprit: the dashboard pulls traces synchronously — on the Agent's loop
The ops dashboard built to observe the Agent's health fetches its data by firing a synchronous, paginated, multi-second HTTP call on the Agent's own event loop. Every dashboard refresh, every monitor scan, pinches the Agent dead for a few seconds. The observability layer was throttling the thing it observes.
Every number on the dashboard — sessions today, AI-resolution rate, P95 latency, recent-sessions list — is aggregated from traces pulled out of Langfuse. The aggregation, simplified, is one line: pull the last 24 hours of traces, group by tag, compute metrics. Pulling traces uses the Langfuse v4 Python SDK's api.trace.list.
The problem is precisely that api.trace.list: it's synchronous. It fires an HTTP request to Langfuse, waits for the response, and yields nothing in between. And a dashboard wants a non-trivial amount of data — the trace list is paginated, capped at 100 per page, several pages — so a multi-second synchronous HTTP round-trip presses squarely onto the event loop.
Lay the physical chain out:
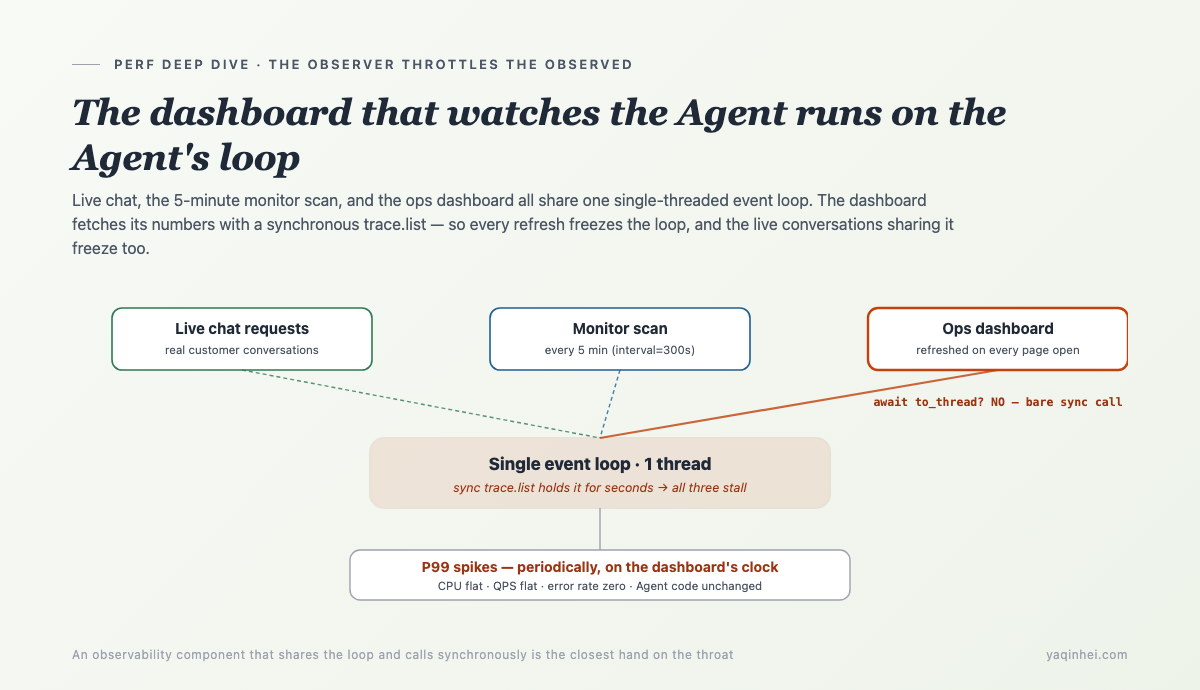
trace.list, doesn't yield for seconds, and the other two freeze with it. The harder the dashboard tries to see the Agent, the harder it pins it down.
This explains every earlier observation that didn't add up, seam for seam:
- Why is CPU flat? Because during those seconds the synchronous HTTP call isn't computing — it's waiting on the network. CPU idle, loop frozen. That's the nastiest thing about blocking: it consumes no CPU, so CPU monitoring is completely blind to it.
- Why are QPS and error rate flat? Because the stuck requests all eventually succeed, just each a few seconds late. No errors, no dropped requests, just slow.
- Why periodic? The dashboard gets refreshed on a human's cadence, the monitor scans on a fixed 5 minutes — the beat comes from them, not from users.
- Why does the Agent slow down with no code change? Because the code doing the pinching isn't on the Agent's request path at all — it's in that dashboard module next door.
A tool built to "see whether the Agent is healthy" became the reason the Agent was unhealthy. That irony isn't a coincidence — an observability component inherently has to pull data frequently and on a timer, and once it shares the loop with the observed service and uses a synchronous call, it's the closest hand on the throat.
Fix one: get the sync call off the loop — asyncio.to_thread
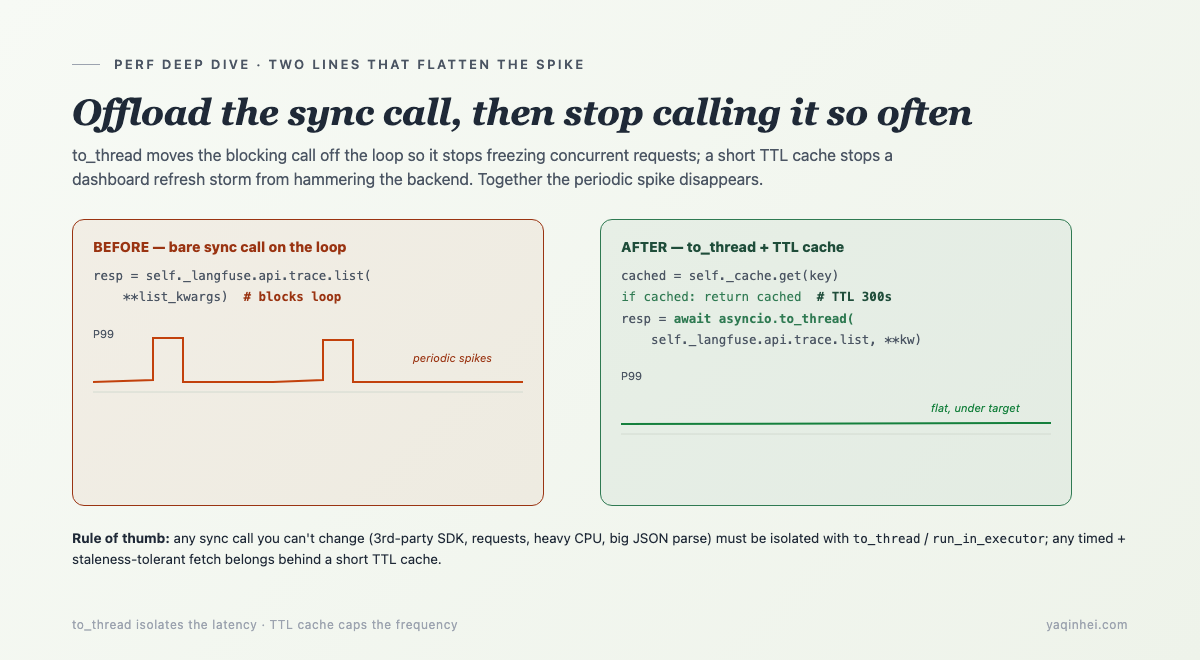
Once located, the first layer of the fix is crisp: since trace.list is an unchangeable synchronous SDK call, don't let it run on the event loop — throw it into a thread pool.
# app/tracing/langfuse_rollup.py
resp = await asyncio.to_thread(self._langfuse.api.trace.list, **list_kwargs)
data = list(resp.data)
asyncio.to_thread runs that synchronous call in a separate thread, and the main loop gets back an awaitable — so during the few seconds it waits for the trace pull, the loop regains the ability to yield and can advance live customer requests as usual. The sync call is still slow, but its slowness is isolated in a thread and no longer contagious to the whole loop.
This one line is the core fix of the entire incident. It deserves to be recorded as a rule: in an async service, any unchangeable synchronous blocking call (a third-party SDK, requests, heavy CPU, big JSON parse) must be isolated with asyncio.to_thread (or run_in_executor) — never call it bare. Calling a synchronous function bare is like dropping a gate in front of every concurrent request.
The same project uses the same trick elsewhere to cover Langfuse's sync SDK — wrapping the synchronous trace pull into a thread:
# same pattern elsewhere: sync SDK always to_thread
vals = await asyncio.to_thread(_work)
The test for "should this be to_thread?" is simple: is there an await in front of this function? No await, and it runs for a while (network/disk/heavy compute), then it's stealing your loop.
Fix two: TTL-cache the dashboard fetch — kill the "refresh storm"
Getting the sync call off the loop isn't enough — you also have to defend against a second hazard: several people staring at the dashboard hammering refresh, each refresh spawning a thread to pull Langfuse, saturating the thread pool and the Langfuse backend together.
to_thread solved "don't block the loop," but not "fetched too often." An ops dashboard is naturally refreshed repeatedly — the person watching jabs F5, several watch at once, requests stack up, each triggering a real Langfuse pull. That's the refresh storm: the observability layer knocking over its own backend.
The fix is a short TTL cache in front of the fetch:
# app/tracing/langfuse_rollup.py
from cachetools import TTLCache

class LangfuseRollup:
    def __init__(self, langfuse, cache_ttl_seconds: int = 300):
        self._cache: TTLCache = TTLCache(maxsize=16, ttl=cache_ttl_seconds)

    async def _fetch_traces_in_window(self, *, hours, limit=100, to_hours=0):
        key = ("traces", hours, limit, to_hours)
        cached = self._cache.get(key)
        if cached is not None:
            return cached          # repeated refreshes within 5 min eat the cache, no Langfuse hit
        ...
        resp = await asyncio.to_thread(self._langfuse.api.trace.list, **list_kwargs)
        self._cache[key] = list(resp.data)
        return self._cache[key]
TTLCache(maxsize=16, ttl=300) — results for a given query window are cached for 5 minutes. No matter how many people refresh how many times in 5 minutes, only the first actually pulls Langfuse; the rest all hit the cache. "Data at most 5 minutes stale" is entirely fine for an ops console — KPIs aren't per-second trades, seeing them 5 minutes late costs nothing, and in exchange the backend doesn't get hammered.
This too generalizes into a rule: any fetch that's timed/frequently-triggered AND tolerates brief staleness should have a TTL cache in front of the real backend. Dashboards, health checks, aggregate reports — all this pattern. The test is one sentence: would seeing this data a few minutes late hurt anyone? No? Then cache it.
The two fixes together — to_thread so a single fetch no longer blocks the loop, TTL cache so the fetch is no longer triggered over and over — made the periodic spike vanish. P99 flattened back below target.
Why every standard monitor stayed green while this kept firing
In this incident, every "metric that should have alerted" didn't — because blocking consumes no CPU, produces no errors, drops no requests; it only makes everything slow, and "slow" is exactly the dimension most monitoring is least sensitive to.
A quick tour of where the blind spots are:
- CPU/memory monitoring can't see it: a synchronous network call is waiting on I/O; CPU is idle. Alerting on CPU will never catch an I/O block.
- Error-rate monitoring can't see it: the stalled requests all succeed in the end, just slow. Error rate doesn't budge.
- Health checks can't see it: the liveness endpoint is light and happens not to land in the blocked instant, so it returns 200. The service is "healthy."
- Averages dilute it: the spikes are periodic and a small fraction; folded into a mean, they nearly vanish. Only tail percentiles like P99/P95 expose the shape of "fast most of the time, frozen for seconds occasionally."
This is the flip side of what I argued in dual-track testing: whether a service is "healthy" and whether it's "fast" are two tracks, and the first being all-green can't stop the second from periodically doubling. This got caught purely because someone watched the P99 curve and pedantically asked, "why is this spike so regular?" — not because any automatic alert fired.
What you should actually add isn't some specific threshold — it's a probe staring directly at "is the event loop stuck." Below is that probe, and a ring of self-checks around it.
10 event-loop gates you can add to your own async service this week
Turn this lesson into actions you can copy straight in — applicable to any asyncio / FastAPI service:
-
Install an event-loop lag probe. Periodically
call_latera callback and measure the drift between when it's actually invoked and when it was scheduled. Loop unblocked, drift near 0; the moment a sync call clutches the loop, drift jumps to seconds. This is the only metric that directly quantifies "how long the loop was stuck":import asyncio, time async def loop_lag_monitor(threshold_s: float = 0.25): loop = asyncio.get_running_loop() while True: t0 = loop.time() await asyncio.sleep(1.0) # expect to wake in 1s drift = loop.time() - t0 - 1.0 # extra sleep = how long loop was stuck if drift > threshold_s: logger.warning("event-loop lag: %.2fs", drift) # emit drift as a metric, read it alongside P99 -
Turn on asyncio debug mode in development.
PYTHONASYNCIODEBUG=1orasyncio.run(main(), debug=True), then lowerloop.slow_callback_duration(e.g. 0.1s). Any callback running longer than the threshold on the loop gets a warning that names it — synchronous blocking shows itself on the spot, no waiting for prod. -
Make "sync calls must be to_thread" a review rule. Any third-party SDK call,
requests.*,time.sleep, heavy CPU, or big JSON parse that appears inside anasync defwith noawaitin front counts as blocking and must be wrapped inasyncio.to_thread/run_in_executor. -
Audit where every scheduled task and background loop lives. List every
asyncio.sleeploop, every cron/scheduler, and confirm which loop they run on. Background tasks that share the loop with live requests are a high-incidence zone — they fire on a timer, manufacturing periodic tail latency. -
Prefer an "offline loop" for observability components. Dashboard fetches, metric aggregation, trace pulls — anything that "frequently pulls data to watch the service" — should be
to_thread'd or moved to a separate process/worker. Don't let monitoring become a latency source. -
Put a TTL cache in front of every timed + staleness-tolerant fetch. Dashboards, reports, aggregate KPIs — a short TTL (minutes) in front of the real backend kills refresh storms. Test: would this data being a few minutes late cause a problem? No → cache.
-
Watch P99/P95, not just averages. Periodic blocking gets diluted by the mean and only shows in tail percentiles. A latency dashboard should default to percentiles; the average is only good for misleading yourself.
-
For periodic slowness, align timestamps before reading business code. Lay the spike instants next to every fixed-interval event (cron, scheduler, cache expiry, dashboard refresh) and match beats. Regularity points at a timer; aligning timestamps is the fastest locator.
-
Treat third-party SDKs as synchronous by default, unless the name says
Asyncor the method is awaitable. Many SDKs (including some observability, payment, and cloud-vendor SDKs) ship only a sync client. Using them in an async service means wrapping in a thread by default. -
Flat CPU + spiky latency = suspect I/O blocking first, not lack of compute. That combination is almost the signature of "a sync call stalling the loop." See it, and don't go adding machines or CPU — go find the synchronous call clutching the loop.
Going deeper
What got hit here is a named old trap in async programming. To place it in a larger context:
- Blocking the event loop: the asyncio docs have a whole section on this — you can't run blocking code on the loop; both CPU-bound work and synchronous I/O must be isolated with an executor. This is a first-principles constraint of async Python, not an optimization tip.
- The cost of cooperative scheduling: cooperative scheduling's upside is no preemption, no lock contention; its cost is that it doesn't preempt — a task that won't yield is something the scheduler can't do anything about. Go's goroutines and Erlang's processes are preemptive and don't have this problem; asyncio isn't. Understanding that difference is understanding why "one sync call can kill the whole room."
- Tail latency and P99: Dean & Barroso's The Tail at Scale is precisely about why tail latency matters far more than the average, and how periodic interference (background tasks, scheduled jobs) specifically pollutes the tail. This spike is a textbook "scheduled background task pollutes P99."
- The reflexivity of observability: a monitoring system consumes the resources it monitors — a general phenomenon (sampling overhead, log I/O, metric pulls). The healthy approach decouples the observation path from the service path in resources: separate loop, separate process, separate quota.
None of this is deep theory; it's the standard kit of writing async services. This bug fired not because it's new, but because the iron law "isolate synchronous calls" got missed once, in an unremarkable dashboard module.
Next in the engineering-postmortem sub-series, I'll pick another "looks harmless, actually a landmine" small cut and take it apart.
Reply with the keyword "LOOP KIT" and I'll send over the Async Event-Loop Blocking Self-Check: 10 gates + ready-to-paste loop-lag probe code + a "should this sync call be to_thread" decision flowchart, a one-pager to tape next to your async service review checklist.
(Channels in the footer — X or email both work.)
Subscribe for updates
Get the latest AI engineering posts delivered to your inbox.