Containment Rate vs Resolution Rate: The Only Customer-Service AI Metric That Matters (How "98% CSAT" Gets Faked)
Fifth piece in the Agentic AI in Practice methodology series. The first four broke down "can the design ship + how not to abandon it after" — L0-L3 grading, the five L2 architecture decisions, fail-closed Critic, deploy and abandon. This one switches dimensions — why 90% of customer-service AI projects pick the wrong north-star metric from day one, and how to redraw it. 中文版:客户满意度 98% 是怎么算出来的——客服 AI 唯一值得当北极星的指标.
That 98% in the CEO's Inbox Sits 24 Percentage Points Away From Real Customer Experience
A weekly email lands in the CEO's inbox: CSAT 98%. The vendor's dashboard makes it explicit — CSAT, positive-rating rate, recommendation score — all three above 9 out of 10. The CEO is in a good mood. Year-end review goes well. The AI customer-service line item gets greenlit.
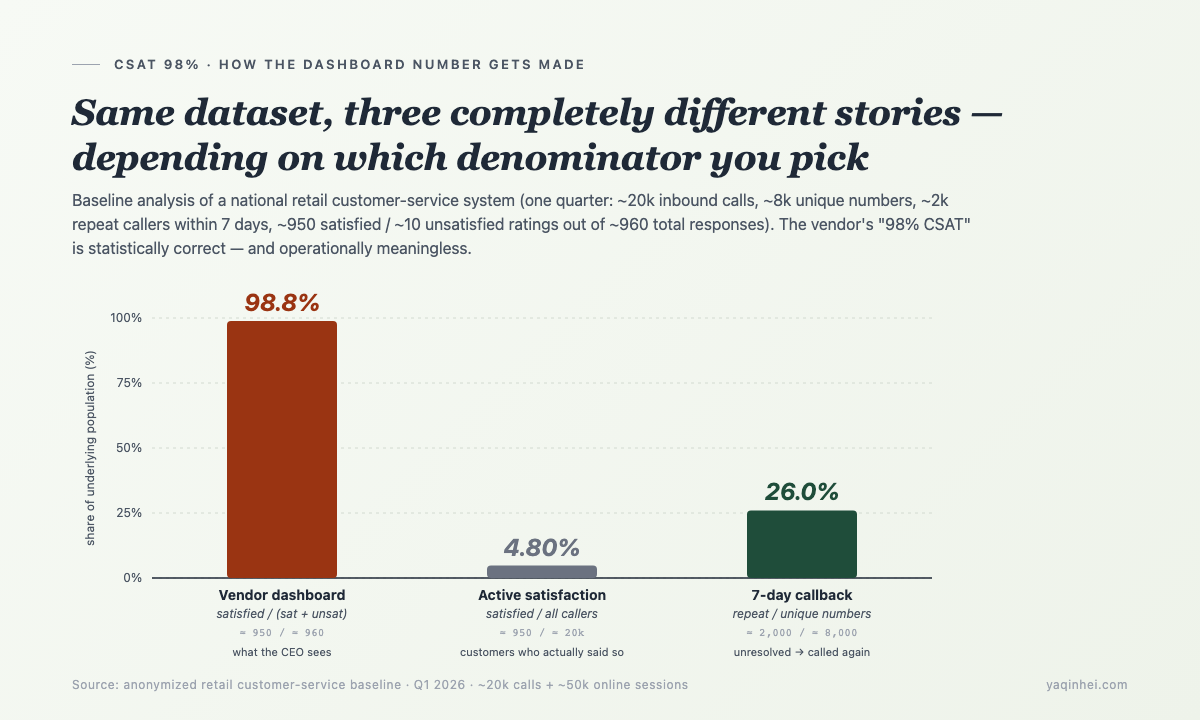
I spent a year doing a full baseline data analysis for a national retail customer-service system (one quarter of data, roughly 50k online sessions plus 20k inbound calls). When the raw data came out of the back-end and sat on my desk, a completely different set of numbers was looking back:
- ~20k inbound calls
- Rating-response rate 4.9% — ~950 rated "satisfied," ~10 rated "unsatisfied," ~19k never said a thing
- Pickup rate 61.8% — 38% of calls never got picked up at all
- ~2k unique numbers called back within 7 days — true First Contact Resolution (FCR) is only 74.1%
So where did that 98% come from? 950 / (950 + 10) ≈ 98.8% — default the ~19k non-responders to "satisfied" and drop them from the denominator. A statistical sleight of hand straight out of a textbook.
The 98% the CEO sees sits at least 24 percentage points away from real customer experience. The AI project's ROI math, KPI definitions, vendor contract — all of it was anchored to a manufactured number. From day one, the entire project pointed the wrong direction.
Every customer-service Agent project I've worked on this year has post-mortems that die on this kind of dashboard. This piece breaks down four things: how 98% gets manufactured, why reusing BOT-era metrics on Agent-era projects fails, how to compute resolution properly, and what five questions to ask the vendor at the next review.
Four Standard Vendor Tricks That Manufacture 98% — All By Swapping Out the Denominator
Verdict up front: any time you see "automation rate 95%," "CSAT 98%," or "FCR 90%," the trick is denominator substitution — non-responders, deflected users, timed-out sessions, and customers who called back through another channel get quietly excluded. The numerator stays. Four standard plays, one by one.
Play 1: silent = satisfied by default. The customer didn't rate the interaction, therefore they're counted as satisfied. In that real baseline, 95% of customers never gave a rating, ~5% rated satisfied, a fraction of a percent rated unsatisfied. The vendor reports "98%" using satisfied / (satisfied + unsatisfied) — the 95% silent majority just disappears. Ask the vendor "what's your rating-response rate?" and most can't answer, because the dashboard doesn't show it.
Play 2: containment rate is not resolution rate. Bot-channel dashboards routinely write "resolution rate = 1 − escalation rate" — meaning "if it didn't escalate to a human, it counts as resolved." But the three most common reasons users don't escalate, none of them mean the problem actually got solved: (1) the user got deflected by something like "please contact your purchase store"; (2) the user timed out and closed the chat; (3) the user gave up at the time and called in the next morning. All three get counted as "resolved," manufacturing a 70-80% containment rate that makes the CEO happy.
Play 3: automation-rate definition gets watered down. A typical industry-template formula is "session_turns ≤ 3 AND status = resolved." But "resolved" gets read from a close_reason enum (normal_close / timeout_close / customer_close / system_close / agent_close). Timeout close + customer close — these two reasons don't prove the problem was actually solved; usually the user just gave up or got distracted. Both still get bucketed under "resolved." Drop the two, and the automation rate falls from 60% to maybe 30-35%.
Play 4: satisfaction sampled only on happy paths. In that real baseline, refund-chasing + complaints/escalation made up 36% of all calls — these users aren't going to tap a rating button, they're already angry. The "rating-response rate" for those categories runs in the low single digits. The remaining "membership lookup," "product customization" — happier categories — have somewhat higher response rates. Roll it all up and the dashboard reports "98% of ratings ≥ 4 stars" — but the denominator is mostly happy-path interactions, almost no angry users.
The common thread across all four: the numerator and denominator are not the same population. Spot this and you can call the meeting at slide 3 of the vendor deck.
Reusing BOT-Era Metrics on Agent Projects Is Pointing the LLM at the Wrong Objective Function
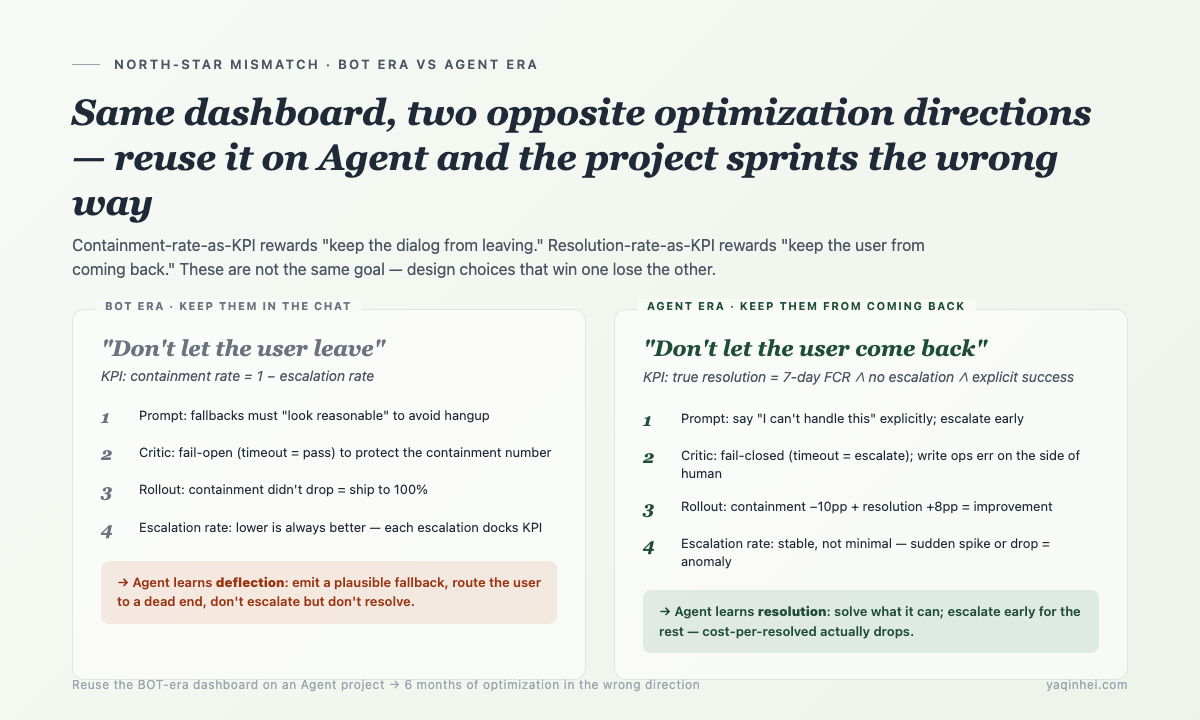
Containment rate optimizes "don't let the dialog leave." Agents should be optimizing "don't let the user come back." These two goals point in opposite directions on prompt design, Critic configuration, and rollout policy.
Containment-rate-as-KPI had its historical logic in the BOT era. Most BOT use cases were FAQ fallback — being able to "contain" the conversation was a respectable outcome. Vendors wrote it into SOWs, reported it monthly, hung KPIs off it. The execution layer knows it cold.
But carrying the same dashboard into the Agent era will cause real damage. Three reasons.
First, the objective function inverts. An Agent optimized for containment learns to emit a plausible-looking fallback that keeps the conversation from escalating — LLMs are extremely good at this, drop the guardrails for a second and they'll fabricate. An Agent optimized for resolution learns to say "I can't handle this" clearly and escalate early — escalation rate has to go up on purpose. These two prompt designs fight each other.
Second, reward-signal contamination. Containment rate = (total_sessions − escalated) / total_sessions — anything that "keeps the conversation in" scores positive, including routing the user into a dead end. RL fine-tuning, prompt engineering, Critic thresholds all end up optimizing for "user doesn't escalate." What the system actually learns is deflection, not resolution. The mechanism is the same one I traced in the ITSM research piece Trained for 60,000 Steps, the Agent Learned to Delete Tickets — the wrong reward function converges the agent on simulated resolution.
Third, rollout policy inverts. When containment is the KPI, a new prompt can ship to 100% as long as containment doesn't drop. When resolution is the KPI, a new prompt that drops containment by 10 points can be an improvement — it means the Agent learned to recognize what it can't handle and escalate early. That "containment-dropped = improvement" judgment is structurally inexpressible on a containment-led dashboard.
Wrong objective function → the whole optimization chain accelerates in the wrong direction. Your project has been running six months, monthly tech reviews show "containment up from 78% to 82%" — there's a real chance the Agent just learned to route more genuine problems into deflection.
How to Compute True Resolution — Three Signals Must All Be True
Any single signal can be gamed; AND the three together and one fake suffices to expose the rest.
The definition: a single call (or session) counts as a "true resolve" only if all three are met:
- The same customer did not raise the same topic again within 7 days (across any channel: phone / online / private / ticket)
- The interaction did not escalate to a human (escalation is the fallback, but once escalated it doesn't count as an Agent resolve)
- There's an explicit success signal — user tapped "resolved," or the user gave a positive follow-up within 10 minutes of session close ("ok," "thanks," "got it")
Three conditions ANDed. Missing one disqualifies. Here's the SQL shape I've ended up at after a year of debugging it:
-- True Resolution Rate
WITH agent_sessions AS (
  SELECT
    session_id,
    customer_id,
    main_topic,
    end_ts,
    -- signal 2: did this escalate to a human
    related_type AS escalated_to_human,
    -- signal 3: explicit success
    close_reason = 'user_explicit_resolved' OR
      has_positive_followup_within_10min AS explicit_success
  FROM agent_session
  WHERE start_ts BETWEEN @t0 AND @t1
),
repeat_within_7d AS (
  SELECT a.session_id
  FROM agent_sessions a
  JOIN all_channel_session b
    ON a.customer_id = b.customer_id
   AND a.main_topic   = b.main_topic
   AND b.start_ts BETWEEN a.end_ts AND a.end_ts + INTERVAL 7 DAY
   AND b.session_id  != a.session_id
)
SELECT
  COUNT(*)                                                AS total,
  SUM(CASE WHEN escalated_to_human = 0
            AND explicit_success
            AND session_id NOT IN (SELECT session_id FROM repeat_within_7d)
       THEN 1 ELSE 0 END) * 1.0 / COUNT(*)               AS true_resolution_rate
FROM agent_sessions;
The hardest piece is the "same topic re-contact" check. The simple approximation: same phone number / same customer_id reaching out again within 7 days as a callback signal. It introduces some noise (the user might be asking about something unrelated), but it's 10× more accurate than reading close_reason. That callback heuristic on the real baseline put FCR at 74.1% — roughly in line with industry norms, and far closer to reality than the vendor's 98%.
A feel for the numbers across system types:
| System type | Containment (vendor framing) | True resolution (3 signals AND) | gap |
|---|---|---|---|
| Traditional BOT (FAQ fallback heavy) | 75-85% | 30-45% | 30-50 pp |
| LLM-flavored BOT (automation-rate inflated) | 85-95% | 40-55% | 35-55 pp |
| Real L2 Agent (containment ≥ deterministic workflow + Critic) | 60-70% | 60-65% | 5-10 pp |
| L2 Agent + heavy Critic + fail-closed | 50-65% | 60-68% | gap reverses (resolution > containment) |
The last row is not a typo — a good Agent's containment is lower than a traditional BOT's, because it actively escalates what it can't handle. But true resolution is 15-25 points higher — the escalated cases actually got solved by a human, not papered over as "handled" by the Agent. Showing the CEO this row will trigger "why did containment drop?" — at which point you walk them back through the §2 objective-function inversion.
Four Vendor Phrases to Cut Down at the Next Review
The four lines below will show up in 2-3 of the slides of any next vendor deck. One-line spot, one-line cut.
Phrase 1: "Our CSAT is 98%." Cut: "Show me the rating-response rate separately." CSAT's definition is satisfied / (satisfied + unsatisfied) — anything with a response rate below 20% is statistically meaningless. The real baseline had 4.9% response with 98% satisfaction — that means 4.8% of customers actively chose to praise the service, which is worse than "very poor."
Phrase 2: "Agent FCR is 90%." Cut: "What's the callback window? Is it cross-channel?" 90% FCR almost always uses a 24-hour window and single-channel — the user calls in the next morning and yesterday's bot session still counts as resolved. The honest window is 7 days, across every channel (phone / online / private / ticket).
Phrase 3: "AI self-evaluation pass rate is 95%." Cut: "Is the evaluator the same LLM evaluating its own outputs?" 95% self-eval pass rates are almost always this circular argument — the same class of system judging the same class of output, nodding at each other. The legitimate approach is human-labeled sampling (external labelers, double-label + arbitration, monthly rolling sample) — covered as the third vendor question in methodology 4.
Phrase 4: "Automation rate 60%." Cut: "Break down close_reason for me." If the formula includes "session_turns ≤ 3 AND resolved," then "resolved" has to exclude timeout-close + customer-close — otherwise the automation rate is contaminated by those two buckets. Once excluded, automation rate typically drops 15-25 points.
Two phrases the vendor can't cut down — this is a demo proposal, not a production proposal. Send them to rebuild the dashboard with denominator and numerator made explicit.
Three Things to Redraw the North Star
Wrong north star → wrong project direction. Replacing it takes three things.
Thing 1: demote containment from primary to secondary metric. Don't delete it — demote it. Containment still has diagnostic value (a sudden 20-point drop means the Agent crashed, the prompt regressed, or the system flaked). But it shouldn't drive KPIs, bonus calculations, or rollout decisions. On the dashboard, move it to a secondary panel; no headline placement.
Thing 2: true resolution as the sole primary metric + human-channel quality monitoring. Only one primary metric — 3-signal-AND true resolution. But two companion signals: (a) did the human actually resolve it after escalation (the human channel also gets 3-signal-AND treatment); (b) escalation rate itself (not "lower is better" — also not "higher is better" — it should be stable; sudden spikes mean the Agent regressed, sudden drops mean the Agent started forcing through cases it can't handle).
Thing 3: cost-per-resolved replaces "automation rate" as the ROI metric. This is the version for the CEO. cost_per_resolved = (Agent_cost + escalated_human_cost) / true_resolves. The number is interpretable — one true resolve costs X dollars. Vendors love "automation rate 60%" because it moves monotonically and is easy to puff up; cost-per-resolved isn't, because a faked resolve inflates the denominator and makes the unit cost look cheaper — but the human cost shows up the next day (user calls back → human picks it up → cost doubles). So cost-per-resolved's formula has to include the second-order human cost from callbacks.
Three things done, the dashboard's top fold looks like this:
═══════════════════════════════════════
   True resolution (north star)   63.4%
   ─────────────────────────────────
   Cost per resolved              $0.65
   Human-channel resolution        88.1%
   ─────────────────────────────────
   Secondary: containment 64.2% · escalation 35.8%
═══════════════════════════════════════
No 98%, no "automation rate 60%," no satisfaction-as-percent-of-positive-ratings. The CEO will be uncomfortable at first, but six months later they'll thank you — true resolution 63% climbing to 70%, cost-per-resolved dropping from $0.65 to $0.50, these two numbers map directly to profit. CEOs understand that.
Six This-Week Self-Check Signals — Is Your Dashboard Containment-Led?
If a project is already running internally, run these six checks. Two yes answers means the dashboard is containment-led.
- Can someone answer "what was last week's true resolution rate" in 30 seconds? Can't → the metric doesn't exist
- Is callback data on the dashboard? 7-day same-topic / cross-channel callback is the core signal of true resolution
- What does the KPI doc actually measure — containment / automation / satisfaction / true resolution? First three = wrong north star
- Is the rating-response rate displayed next to the CSAT number? Not displayed → that CSAT number can't be used
- Who tags "resolved"? Agent / customer / system-timeout — the last two don't count
- Are escalated interactions tracked through to outcome? Escalation is just handoff, whether the issue actually got solved is a separate question — 90% of projects skip this
Three out of six yes — the gap between the "98% satisfaction" in the vendor's email to the CEO and real customer experience is widening every month, large enough that customers will post about it on social media before anyone internally notices.
Five Questions to Ask the Vendor
Next vendor review, after they finish the deck, ask these five.
Q1: Is your "satisfaction" defined as satisfied/(satisfied+unsatisfied) or satisfied/all_interactions? Acceptable: denominator is all customers who interacted, with non-responders surfaced separately. Unacceptable: "industry standard is to count only respondents" — that's the source of the 98%.
Q2: What's the callback window for resolution? Is it cross-channel? Acceptable: 7 days, all channels (phone / online / private / ticket). Unacceptable: "24 hours, same channel, no callback = resolved" — the customer slept through it.
Q3: When the Critic escalates, does that count as a resolution failure or a resolution success? Acceptable: escalation doesn't count as Agent resolution, but the human channel's outcome is tracked separately. Unacceptable: "escalation counts as success because the issue was handled" — end the review.
Q4: If containment drops 10 points and true resolution rises 8 points, how does the bonus get calculated? Acceptable: bonus is tied to true resolution; containment doesn't move it. Unacceptable: "our SOW is written against containment" — this isn't the SOW you need.
Q5: Can you pull out the "non-responder" customers on a separate distribution chart? Acceptable: yes, broken down by topic, dwell time, callback behavior. Unacceptable: "non-responders aren't in our metric system" — that means 95% of customers are invisible on the dashboard.
Two questions they can't answer — this is a demo proposal. Have the vendor rebuild the dashboard and metric definitions, or change vendors. Wrong north star, all downstream effort is pointing in the wrong direction.
Wrap: Pick the Right North Star, the Whole Project Self-Corrects
That 98% in the CEO's inbox isn't a vendor lie — they're using denominator-cheating math the industry has refined over 30 years. The real problem is the buyer doesn't have their own metric definitions — they copied the vendor's into the contract, hung KPIs on it, and six months in everyone is optimizing toward a fake target.
Redrawing the north star is technically straightforward (a few SQL queries, a dashboard module, a monthly callback-heuristic recalibration). The hard part is talking the boss into dropping the 98% — they're already attached to the comfort that number provides.
Execution-layer leverage is narrow but high: pull up the "same dataset, three stories" chart at the next post-mortem; put the four fake-resolution phrases on a one-pager; tape the five questions to the wall of the vendor-review room. The north star drawn right, all downstream effort automatically points the same direction.
Get the toolkit
If you want to use this in your next vendor review, here's a PDF kit:
Send me the keyword "NORTH-STAR" and I'll send the pack:
- True-resolution 3-signal-AND SQL template (callback judgment, cross-channel join, fallback approximation included)
- Four fake-resolution phrase ID cards (vendor-review use; each card has a "one-line cut")
- Five vendor-review questions (with acceptable / unacceptable answer samples — read them as-is)
- Dashboard top-fold redesign mockup (true-resolution / cost-per-resolved / escalation rate three-tile layout)
A year of customer-service Agent baseline-analysis work compressed into the tools, shared with anyone who got this far.
(Channels in the footer — X or email both work.)
What's Next in This Series
The next four in this methodology line:
- Skills vs knowledge base — the Agent's brain vs hands: why the knowledge base caps the ceiling and Skills cap the speed; how to layer them in enterprise rollout
- 3-tier intent cascade tuning (deep dive on decision 2 from the L2 architecture piece): confidence thresholds for rules + embedding + LLM fallback, caching strategy, how to add new intents without breaking existing ones
- LLM-into-enterprise-SaaS integration (deep dive on decision 4): packaging 25 APIs into 5 tools, idempotency contracts, timeout/retry, rollout
- First-major-incident post-mortem SOP (continues from deploy and abandon): what to do in the first 24 hours, how to write the post-mortem, how to revise KPIs so the same incident can't repeat
If your team is building customer-service Agents or other L2 write-operation Agents, these four will ship one at a time over the next 3-4 weeks.
Subscribe for updates
Get the latest AI engineering posts delivered to your inbox.