I Ran the Whole Token-Saving Playbook. The Savings Got Re-Spent.
AI CODING DEEP DIVE. An engineering measurement, not a tool endorsement. I ran a million-view "cut your tokens by 90%" playbook end to end, then opened Claude Code's own usage attribution panel and found the bill was nowhere near where I assumed. Every number here comes off my own machine. 中文版:Claude Code 省 token:四个工具我全上了,省下来的却被我自己花掉了。
One SSE chain. 19 files. 8,716 lines.
I maintain an enterprise customer-service Agent platform. Python backend, React ops console, 610 .py files, 101 .tsx files, 123k lines of git-tracked source.
Last month I put Claude Code on a problem: the streaming reply sometimes dies mid-flight and the front end spins forever. That is an SSE chain — the backend handler emits text/event-stream, it crosses a gateway, crosses retry logic, and lands in the front end's EventSource consumer, renderer, and error fallback.
I measured how much code that chain actually touches:
grep -rlE "EventSource|text/event-stream|StreamingResponse|\bSSE\b" \
  --include="*.py" --include="*.ts" --include="*.tsx" . \
  | grep -vE "node_modules|tests?/" | xargs wc -l | tail -1
#   8716 total   (19 files)
19 files. 8,716 lines. To decide which segment cut the stream, essentially all 19 have to enter the context. You cannot read only the handler, because the break could be a gateway timeout, an onerror that never reconnects, or a buffer in between.
One chain eats a solid slice of the context window.
I hit the 5-hour MAX ceiling a bit over two hours into that session.
Then a tweet came across my feed with 1.1 million views:
Cut Your Claude Code Token Usage by 90% He leaked the exact methods. Most people will scroll past it.
Attached was an 18-minute 30-second video by John Kim (Claude Code / AI coding content; he recently launched a paid course with ByteByteGo). I transcribed it — and he is considerably more honest than the tweet that carried him. Four strategies, each shipped with its trade-off. Not a one-click-to-orbit pitch.
I ran the playbook. Tools installed, index built. The ceiling did get further away.
Then I measured the actual line items on my bill and found two things: the four tools cover two of them, and the budget I freed up got immediately re-spent by me.
The four strategies
Worth stating plainly, or the rest has no baseline.
① Index the codebase. codegraph turns the repo into a queryable graph. Claude Code's default is grep → read → scan; to find one auth.ts it drags every file on the path into context. Indexed, that becomes "query the graph, get one node back, not the repo."
He names three trade-offs. The first is the important one: an index gives you a second source of truth. Code is one, the graph is another; forget to sync and Claude will be confidently wrong. Second: the query path skips module-level CLAUDE.md files that a normal grep would have picked up. Third — he says it in passing, but for my workload it is fatal — once it finds the file you still have to read the file. You saved retrieval tokens, not reading tokens.
② Compress tool output. rtk, a Rust CLI proxy, squeezes noisy output (npm run, git log, test runs) before it reaches the window. His slide shows 8,400 tokens down to 1,010 — −88%. Trade-off: it is lossy.
③ Make the model talk less. caveman, a skill with light / full / ultra tiers, makes Claude answer like a caveman: same content, half the output. The trade-off is well put — the previous turn's output is fed back as the next turn's context. Wreck the output and you wreck your own context history; the agentic loop gets dumber.
④ Basic session hygiene. /context to see who is eating tokens, /clear, /model, plan mode before execution. He calls out one example: a 50k CLAUDE.md burning 4% of your window on every session open.
All four are correct. That is not the question.
Five token hogs. The four tools reach two.
Put the bill on the table. I measured every real token hog on that customer-service platform — not guessed, measured with wc and du:
| My token hog | Measured | Shape |
|---|---|---|
| Tracing one SSE chain | 19 files · 8,716 lines | code, back end + front end |
| Reading an enterprise API spec | 209 pages · ~35k tokens in one pour | document flooding |
| Knowledge governance / labeling corpus | 5.3 MB · 24 documents | document flooding |
| Digging through a day of business logs | 52.4 MB / day | command output |
A bloated CLAUDE.md | 49,480 characters | resident context |
Now lay the four tools across it:
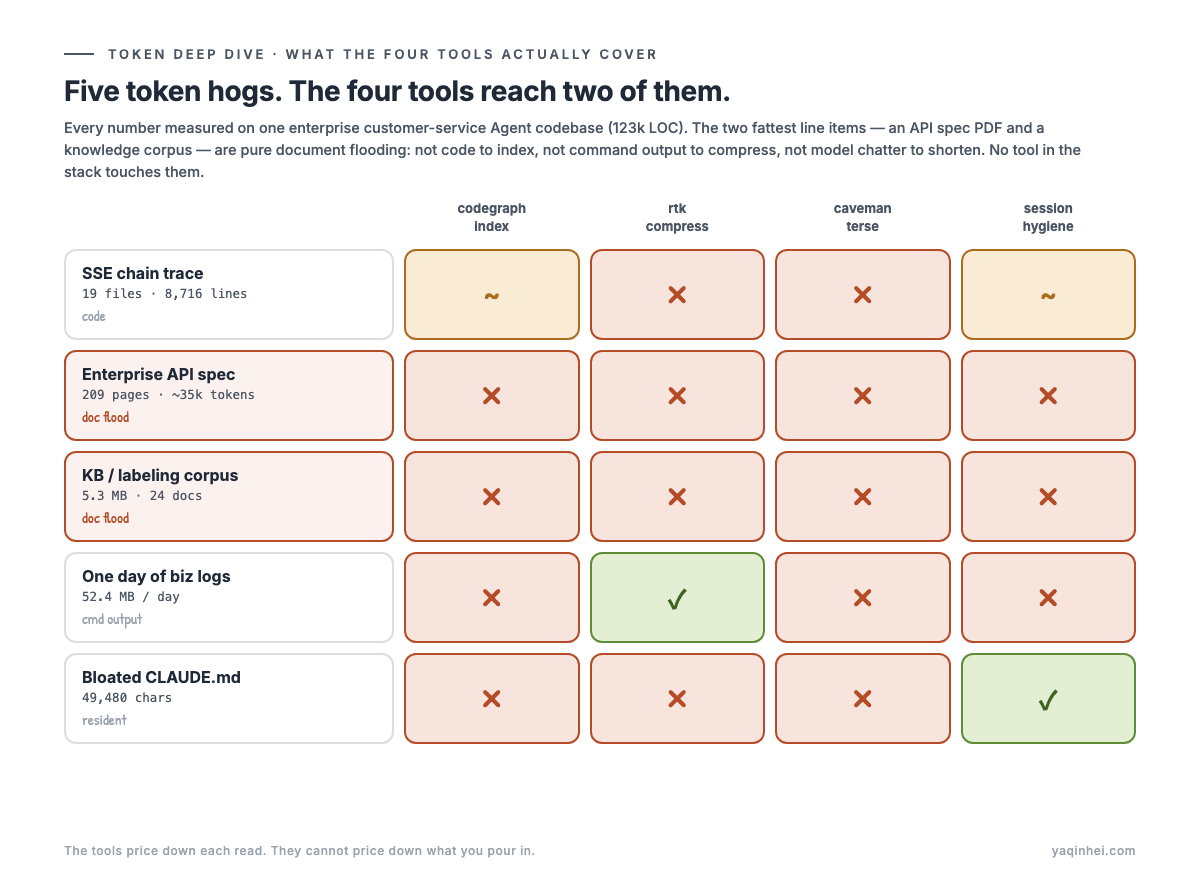
Five hogs. The tools genuinely reach two.
Read what the matrix is saying: the playbook targets four surfaces — code retrieval, command output, model output, session hygiene. The two fattest items on my bill — a 209-page API spec and a 5.3 MB knowledge corpus — are pure document flooding. That surface is not on the list.
That interface manual is 209 pages. Extracted to plain text it is 87,621 characters — about 35k tokens in a single pour, more than double my entire pre-diet CLAUDE.md, and it covers exactly one of the systems I have to integrate with.
(The file is 13 MB. But megabytes are the wrong unit of pain — tokens are. Enterprise documents look like this: hundreds of pages, and past the prose it is all request/response tables, status codes, error-code appendices.)
There is no grep-shaped hole in that document. You cannot "query the graph and find it," because it is the thing you have to read. codegraph cannot index it (not code), rtk cannot compress it (not command output), caveman is irrelevant (not model output). It is pure input, poured in.
Anyone shipping Agents inside a company knows this weight class: interface manuals, business-rule compendiums, labeling specs, knowledge-base corpora — every one of them megabytes, and every one of them a "must be understood" document rather than a "search it when needed" document.
That is why 82% of my usage sits above 150k of context. Not because grep read too many files — because I am pouring PDFs into the window.
The attribution panel: the savings got re-spent
Claude Code now tells you what usage shape is eating your budget. Here is the raw panel from my earlier snapshot:
95% of your usage was at >150k context
   Longer sessions are more expensive even when cached.

64% of your usage came from sessions active for 8+ hours

39% of your usage was while 4+ sessions ran in parallel
   All sessions share one limit.

27% of your usage came from subagent-heavy sessions
   Each subagent runs its own requests.
And the last 24 hours:
82% of your usage was at >150k context
73% of your usage came from subagent-heavy sessions      ← 27% → 73%
39% of your usage was while 4+ sessions ran in parallel
23% of your usage came from sessions active for 8+ hours ← 64% → 23%

Plugins                             % of usage
superpowers                            33%
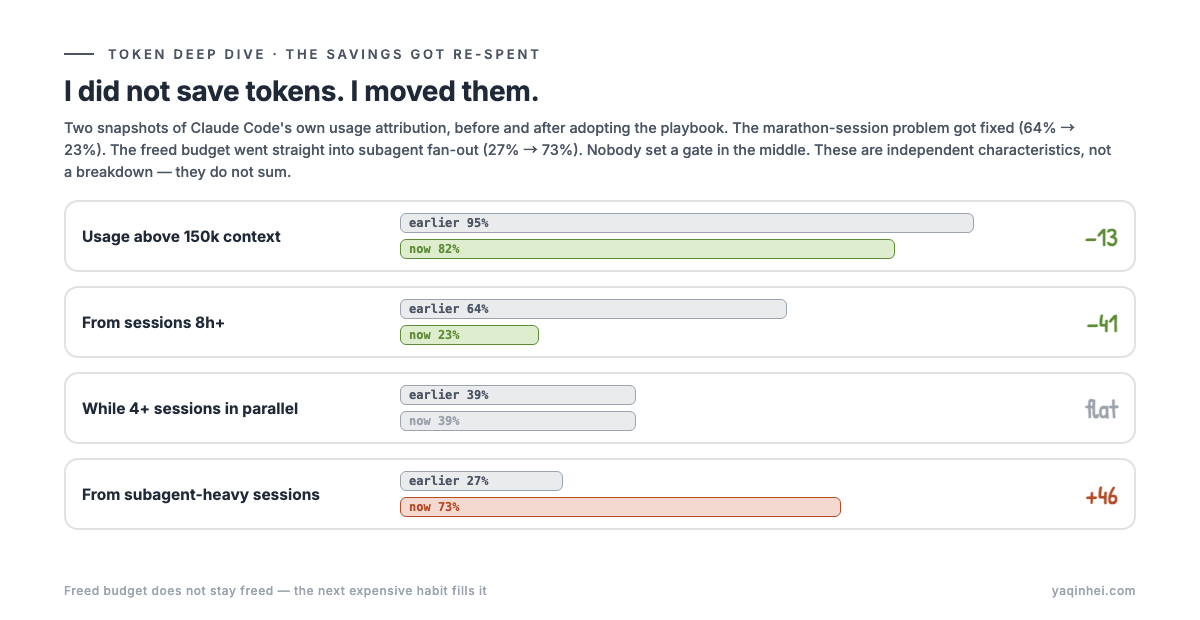
The marathon-session problem is genuinely fixed (64% → 23%). /clear, /compact, and the index all did their job.
And the freed budget went straight into subagent fan-out (27% → 73%). The skill leaderboard on the same panel confirms it: superpowers accounts for 33% of usage, subagent-driven-development alone for 13%, general-purpose subagents for 8%.
The 39% from parallel sessions did not move at all — four windows open at once, sharing one budget pool.
One caveat, and it matters: the panel itself says "independent characteristics, not a breakdown." These four percentages do not sum; this is not a pie chart. It counts local sessions on one machine. The two snapshots are different time windows — an observation, not a controlled experiment. So I will not claim "tool X caused drop Y." I will only claim: my usage shape changed, and it did not change in the direction I assumed.
Swapping every bulb for LED while four air conditioners run.
Cut one: my CLAUDE.md was 49,480 characters
That "50k CLAUDE.md burns 4% on every open" example from the video is, literally, me.
wc -m ~/.claude/CLAUDE.md ~/.claude/rules/*.md ./CLAUDE.md
#   9994  ~/.claude/CLAUDE.md
#   6128  ~/.claude/rules/doc-verification.md
#  49480  ./CLAUDE.md          ← this blog repo
I was writing an article about saving tokens inside a repo that spends 50k characters before I type a word.
The content is not wrong. Those 49,480 characters contain no filler — every line is a scar: distDir silently breaks Vercel, never build while the dev server is up, bilingual diagrams need per-language heights, WeChat orphans a colon after bold. The problem is when it loads.
Writing-style rules, the bilingual production pipeline, the hand-drawn visual spec — two thirds of the file — only matter when I am drafting an article or rendering a diagram. When I change one line of lib/db.ts, not a word of it applies, and all of it loads.
The fix is not deletion. It is redistribution by load time:
CLAUDE.md          → resident every session (architecture + the silent, expensive traps)
.claude/skills/    → loads only when the task matches (writing / translation / SEO pipelines)
notes/             → read only when you need the provenance (why, how found, repro)
I moved the writing style, production pipeline, and visual spec wholesale into a write-post skill, leaving one hard pointer in CLAUDE.md: "drafting an original post → invoke write-post first." Not one rule was lost — I wrote a script to verify distDir / ensurePostInDB / the punctuation-orphan rule / the CJK font names all survive, and that all 18 notes are still referenced.
| memory files | Before | After |
|---|---|---|
| 4 files combined | 67,987 chars | 30,311 chars |
| In tokens (measured 2.23 chars/token) | ≈ 30.5k | 13.6k |
17k tokens saved at the top of every single session. Zero cost, zero loss, no second source of truth to keep in sync.
Best return on the whole list, and it requires installing nothing. If you do one thing, do this.
Two more hidden residents, found by accident
After the diet, /context opens at 46.8k tokens. Broken down:
System prompt:  5.5k
System tools:   8.8k
Custom agents:  6.0k  ·  20 agents      ← I wrote 4 of them
Memory files:  13.6k  ·  4 files        ← just slimmed
Skills:         9.8k  ·  193 skills     ← 193
Messages:       3.1k
MCP tools:      0 tokens · 33 tools (loaded on-demand)   ← note this line
193 skills and 20 agents: 15.8k tokens, 34% of the opening window. I wrote 4 of those agents; plugins supplied the other 16. Counting them up: huggingface-skills ships 92 skills, plugin-dev 77 skills plus 33 agents, pr-review-toolkit 66 agents, vercel 44 skills. I have used none of them. Every skill's name and description sits resident, purely so the model knows it exists.
Meanwhile MCP tools · 33 tools · 0 tokens (loaded on-demand) is the correct architecture — MCP pulls a tool's schema only when it is called. Skills and agents are resident in full.
Detection signal: if skills + agents exceed 10k tokens in your /context, go look at whether you actually use those plugins.
Cut two: rtk was installed and had never saved a single token
This is the part I most want you to keep.
I installed rtk a while ago. which rtk answers. rtk --version prints 0.43.0. I assumed it was quietly saving me tokens — especially against that 52 MB daily business log, where I figured "rtk has my back."
Then I checked whether it was actually wired in:
grep -rn "rtk" ~/.claude/settings.json ~/.claude/CLAUDE.md   # empty
grep -rn "rtk" ~/.zshrc ~/.zshenv ~/.zprofile                # empty
Empty.
rtk is an explicit-invocation proxy — you have to write rtk git log, rtk test, rtk read. It hijacks nothing. And on my machine nothing anywhere told Claude Code to use it. It had never been called once.
I had downloaded a binary to disk and believed I was saving tokens.
This is not carelessness. It is an entire failure class: installed is not wired. Installation is visible — which answers, the version prints. Wiring is invisible. Nothing errors. No metric drops. You simply keep burning tokens inside the belief that you already optimised.
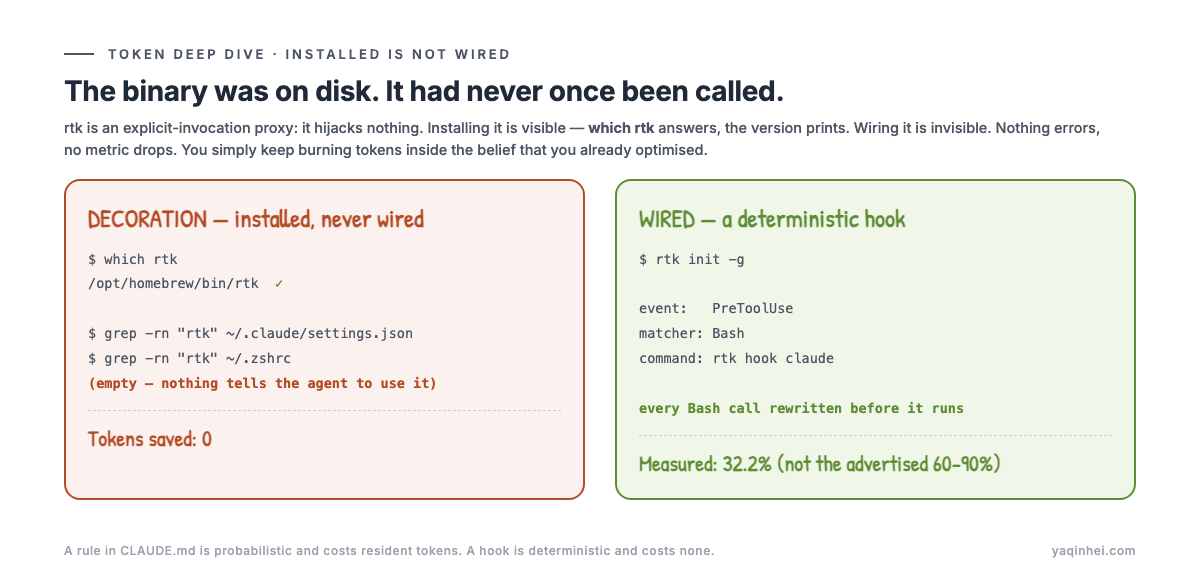
Thirty-second self-check you can run right now:
# Is this tool actually wired in? empty = it is decoration
grep -rn "rtk" ~/.claude/settings.json ~/.claude/CLAUDE.md ~/.zshrc 2>/dev/null
The right way to wire it is not a rule in CLAUDE.md saying "remember to use rtk" — that is probabilistic, the model forgets, and the rule itself costs resident tokens (a token-saving rule should not cost tokens). rtk announces the answer itself:
[rtk] /!\ No hook installed — run `rtk init -g` for automatic token savings
rtk init -g installs a deterministic hook:
event:   PreToolUse
matcher: Bash
command: rtk hook claude
Every Bash call is intercepted and rewritten before it runs. No reliance on the model's memory. Resident cost: a 958-character RTK.md (≈430 tokens). Noise.
The real compression ratio is 32.2%, not 88%
With the hook in place, rtk's own accounting:
$ rtk gain
Total commands:    5
Tokens saved:      1.1K (32.2%)
Single command, measured:
git log -20 | wc -c        # 7,955 chars
rtk git log -20 | wc -c    # 3,825 chars      ↓ 52%
The video says −88% (8,400 → 1,010). rtk's own README says 60–90%. My real aggregate is 32.2%.
Nobody is lying. −88% comes from a hand-picked noisy build log — that output really is garbage, and squeezing nine tenths of it costs nothing. My daily commands are full of git log, git diff, ls — things that were not that redundant to begin with. There is less water to wring out.
Five commands is a thin sample; it will sharpen over a week. The direction will not change: the percentage you can save depends on how much of your output is noise, not on what the tool advertises.
Question one to bring to your next vendor meeting: when someone says "our approach saves X%", ask what the denominator is, how the sample was chosen, and whether their workload looks anything like yours.
A failure mode that belongs on your checklist
The hook intercepts at PreToolUse, which means it silently compresses what you believe is raw output.
While chasing that SSE disconnect, raw logs were exactly what I needed — which second the heartbeat stopped, which connection closed early. rtk could easily have folded that line into "(842 more lines omitted)" without telling me. That becomes a ghost bug — "the line just isn't in the log" — and it can eat an afternoon.
Escape hatch:
rtk proxy <cmd> # bypass compression, get raw output
The irony is that this is the same failure class I spent nine days on in production: you think you are looking at the source, you are looking at a derivative. That time it was a knowledge base whose search index had silently drifted from its source files for nine days — the business saw nine-day-old copy in the console while every dashboard stayed green.
Same hole, third encounter: first in the KB index, then in the code graph below, now in my own terminal output.
Cut three: codegraph's stale window is exactly 300 seconds
The video says the index "goes stale, remember to sync." Too coarse. I read the daemon log:
[CodeGraph MCP] Auto-synced 18 file(s) in 261ms
[CodeGraph MCP] Auto-synced 1 file(s) in 131ms
[CodeGraph MCP] File watcher active — graph will auto-sync on changes
[CodeGraph daemon] Shutting down (idle timeout; clients=0).
[CodeGraph daemon] Listening on ... (pid 47135, v1.3.0). Idle timeout 300000ms.
Three things fall out:
- While the daemon is awake, a file watcher syncs changes automatically (131ms per file). The "forgot to sync" fear from the video is already handled in this version.
Idle timeout 300000ms— after five idle minutes the daemon shuts itself down. Nothing is watching your edits during that window.- But it back-scans on wake — that
Auto-synced 18 file(s)is what a back-scan looks like.
The accurate statement: stale is not permanent desync. It is delayed eventual consistency, and the delay window is exactly "how long the daemon slept, plus its back-scan."
That distinction earns its keep. "It goes stale" sounds like a landmine you must forever watch for. "After 300 idle seconds it enters delayed consistency" is a system property you can reason about — it tells you that asking "where does this function live" immediately after an edit may get an answer from five minutes ago, while during continuous coding the graph is accurate.
Detection signal:
tail -20 <repo>/.codegraph/daemon.log
# watch the rhythm of "Auto-synced" against "Shutting down (idle timeout)"
# only Shutting down, never Auto-synced → the watcher is dead. That is the real landmine.
One thing I did not see coming: exactly one repo on my machine is indexed. The 123k-line customer-service Agent has a .codegraph. This blog repo — where 82% of my long-context sessions actually happen — has nothing.
The tool went into the repo that most looks like it needs an index, not the repo that costs the most. Those are different things, and I never checked.
I deliberately skipped caveman
Three of four.
caveman saves output tokens. But per its own README, the skill adds 1–1.5k input tokens to every turn (the skill itself must sit in context).
For a usage shape where 82% of the spend happens above 150k of context, that math does not close: my bottleneck is not a chatty model, it is the 35k tokens of API spec I poured in. Paying 1.5k input per turn to halve the output is a doubtful trade, and the cost is a coarser context history and a dumber loop.
The video's author runs ultra permanently. That tells you his workload is not mine — which is the best possible argument against copying anyone's config.
Skipping it is a decision, not an omission.
The culprit: 73% eaten by subagents with no model declared
Back to that 27% → 73%.
My own four agents all declare a model:
$ grep -H "^model:" ~/.claude/agents/*.md
codegen-boilerplate.md:model: sonnet
coordinator.md:model: sonnet
debugger.md:model: sonnet
ui-helper.md:model: sonnet
Then I looked inside the skill that accounts for 13% of my usage:
$ find ~/.claude/plugins -path "*subagent-driven-development*" -name "*.md"
.../subagent-driven-development/SKILL.md
.../subagent-driven-development/implementer-prompt.md
.../subagent-driven-development/task-reviewer-prompt.md
.../dispatching-parallel-agents/SKILL.md
Not one of those files declares model:.
No declaration means inherit the main model. My main model is Opus.
My four hand-written agents dutifully run Sonnet, while this skill spins up a squad of implementers and reviewers that all run on Opus.
That is the whole answer to 27% → 73%. No guessing required.
And in 18 minutes and 30 seconds of video, subagents and parallel sessions are never mentioned once.
Not an oversight. The four strategies simply do not operate at that layer.
Retail and wholesale
The tools discount the price of a single read. What actually consumes the budget is how much you pour in × how many run at once × how long each lives × how wide it fans out.
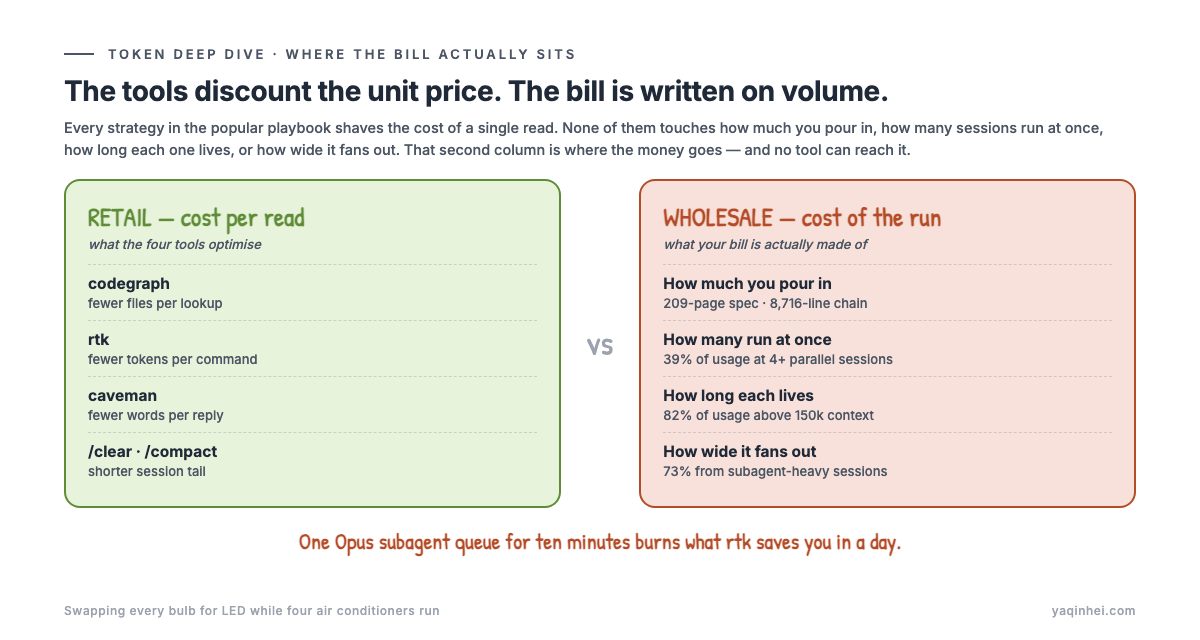
- Retail (what the video teaches): files per lookup, tokens per log line, words per reply. Tools handle this. The return is a percentage — 30%, 50%.
- Wholesale (where the bill lives): the 209-page spec you poured in, the 8,716-line chain you traced, the four sessions you left open, the Opus squad you spun up. Tools cannot reach this, because it is your work content and your working habits, not your command output.
One Opus subagent queue for ten minutes burns what rtk saves you in a day.
And freed budget does not stay freed — that is the counterintuitive part. I fixed marathon sessions (64% → 23%), the ceiling loosened, and I responded by reaching more freely for subagent squads (27% → 73%). No gate in the middle. The room you clear gets filled by the next expensive habit.
Which is why the attribution panel is worth more than any single token-saving tool: it is the only thing that tells you where the savings went.
How to treat the blind spot: documents cannot be poured, only architected
The four tools are useless against the 209-page spec and the 5.3 MB corpus. But "no tool fixes it" is not "no fix exists" — the cure just lives at the architecture layer.
One idea: take the on-demand pattern Claude Code already uses for MCP, and apply it to documents.
Remember that line in /context — MCP tools · 33 tools · 0 tokens (loaded on-demand). Thirty-three tools, zero opening cost, because the schema is pulled only when the tool is called. Skills and agents are fully resident, and 193 of them cost 9.8k.
Same logic: a document should not sit inside the context. It should hang outside it, waiting to be fetched.
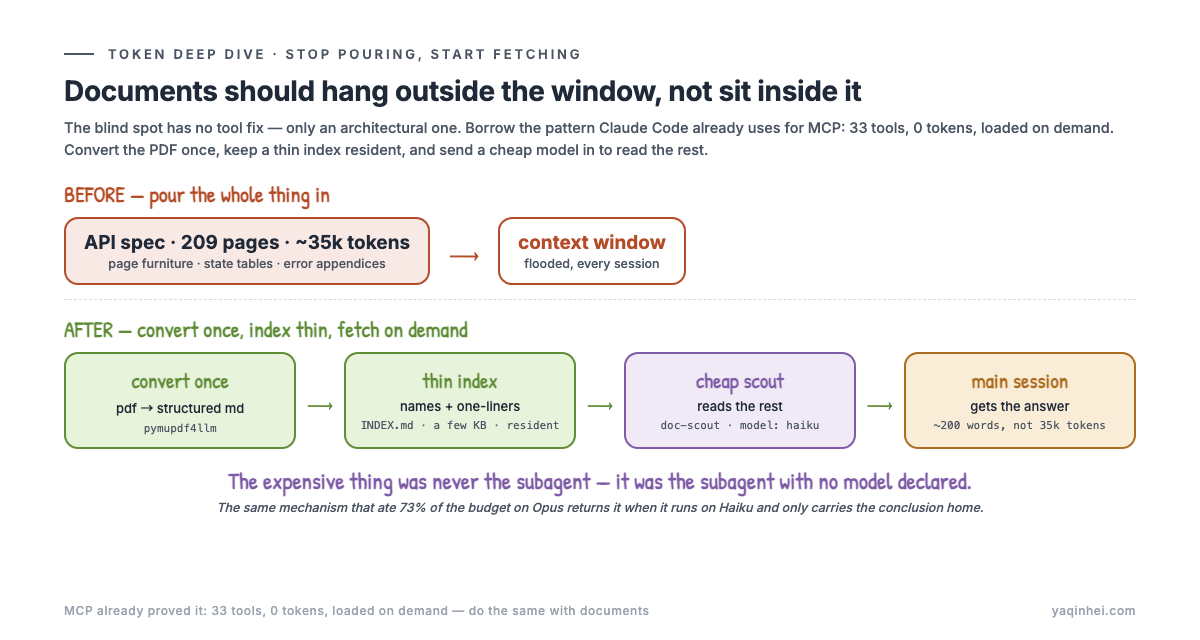
Step one: convert once, never re-read the PDF. PDF is the worst possible input format — layout furniture, headers, footers, lines broken across pages, all of it tokens. Convert to structured markdown once, and read only the conversion from then on:
python3 -c "
import pymupdf4llm, pathlib
md = pymupdf4llm.to_markdown('api-manual.pdf')
pathlib.Path('api-manual.md').write_text(md)
"
wc -c api-manual.pdf api-manual.md   # see how much weight came off
Step two: build a thin index so it reads only the section it needs. The Agent never wants the whole manual; it wants "what are the parameters for the refund endpoint." So give it a slim endpoint list (a few KB) and a way to fetch details by name:
docs/api/
  INDEX.md          ← endpoint names + one-liners + which file (a few KB, safe to keep resident)
  refund.md         ← fetched on demand
  logistics.md
  price-protect.md
INDEX.md goes into CLAUDE.md or a skill; the detail files get Read on demand. That trades a 35k-token resident cost for a few KB resident plus tens of KB on demand.
Step three: send a cheap model to chew the documents; the main agent takes only the conclusion. This is the one genuinely money-saving use of a subagent — what it saves is not compute, it is the main session's context:
---
name: doc-scout
description: Read-only document scout — find the answer in large docs, return the conclusion plus its location. Never paste long passages.
model: haiku
tools: Read, Grep, Glob
---
You are a document scout. Find the answer in the given documents and return
the conclusion plus the section it came from. Do not paste long excerpts —
the main agent's context is expensive; yours is not.
The main session asks "how does the refund endpoint decide eligibility," doc-scout chews through hundreds of pages on Haiku, and carries home only the conclusion. What enters the main context is 200 words, not 35k tokens.
Note the reversal here: subagents are the villain behind 73% of my bill — but only because they ran on Opus doing implement-and-review, work that is expensive by nature. The same mechanism, running Haiku to read documents and find answers, flips from the largest cost line to the most effective saving.
The expensive thing was never the subagent. It was the subagent with no model declared.
Closing the 73%: declare a model on everything
# find every agent with no model declared — they all run your main model
grep -L "^model:" ~/.claude/agents/*.md
grep -rL "^model:" ~/.claude/plugins/*/*/agents/*.md 2>/dev/null
Declare explicitly on everything you write. Search, location, log reading, document chewing — read-only scouting — model: haiku is plenty. Implementation and review are what earn a large model.
For plugin-supplied agents with no declaration (like the subagent-driven-development eating 13% of my usage), you cannot edit their source — what you can change is the calling habit: heavy weapons only for genuinely independent multi-task work. Writing an article, editing a config, refactoring one file: one agent is enough.
Full disclosure: of those three steps, doc-scout is built; the PDF conversion and index split are still in progress — the next post brings the measurements back. Everything already measured in this one (CLAUDE.md 30.5k → 13.6k, rtk hook at 32.2%) is finished work.
When to switch each one on, and when to kill it
| Situation | codegraph | rtk | caveman | subagent fan-out |
|---|---|---|---|---|
| Learning an unfamiliar large codebase | ✅ its home turf | ✅ on | ⬜ whatever | ❌ no squads |
| Everyday feature work on one module | ✅ on | ✅ on | ⚠️ depends on context length | ❌ one agent suffices |
| Chasing a cross-stack bug / reading raw logs | ✅ on | ❌ off (rtk proxy) — lossy compression eats the line you need | ❌ off | ❌ off |
| Asking "where is this function" right after an edit | ⚠️ the index may still be five minutes behind | ✅ on | ⬜ | ⬜ |
| Pouring in a large PDF / knowledge corpus | ❌ all four fail — convert, split, index, fetch on demand | ❌ | ❌ | ⬜ |
| Genuinely independent parallel tasks | ✅ on | ✅ on | ⬜ | ✅ worth it — but declare a cheap model on every agent |
| Writing prose / editing config / one-file refactor | ⬜ | ✅ on | ⬜ | ❌ never the heavy weapon |
Ten things you can do this week
- Measure your hogs. Do not guess.
wc -lthe chain you trace most often;du -shthe document directory you feed the Agent. Know where the money goes before talking about saving it. - Run
/context. Memory files, skills, custom agents — how many tokens each. That is your opening burden. - Run the usage attribution panel. Above-150k context / 8h+ sessions / parallel sessions / subagent-heavy. They do not sum. It is not a pie chart.
- Measure your CLAUDE.md:
wc -m ~/.claude/CLAUDE.md ./CLAUDE.md. Past 30k characters, split it. - Redistribute by load time: resident rules stay in CLAUDE.md, task pipelines become skills, provenance goes to notes. Do not delete content — change when it loads.
- Check whether your tools are decorations:
grep -rn "<tool>" ~/.claude/settings.json ~/.claude/CLAUDE.md ~/.zshrc. Empty means it has never been called. - Give every compressor an escape hatch and write it on the checklist. With rtk, memorise
rtk proxy <cmd>— or lose an afternoon to a ghost bug. grep -L "^model:" <plugin>/agents/*.md. Anything with no declaration is running your main model.- Read the daemon log instead of trusting "the index syncs itself":
tail -20 .codegraph/daemon.log, watch for theAuto-synced/idle timeoutrhythm. - Never feed a large document whole. Split the 13 MB spec by endpoint, extract structured summaries, let the Agent fetch on demand — no tool helps here, only architecture.
The counterargument: the complexity cost is real
The video's author closes with something honest: run all four and your biggest cost is complexity. The index goes stale, compression is lossy, caveman over-trims — three new failure points to juggle.
I would add one he does not say: all three failure points share a shape — you think you are looking at the source, you are looking at a derivative. Code vs graph. Raw output vs compressed. Full history vs trimmed. Each one adds a layer between you and the truth, and each layer will lie to you silently at exactly the moment you most need the truth: while chasing a bug.
There is a counterargument worth reading — Token Inflation Nightmare: Are Your Claude "Hacks" Actually Burning Your Cash? — which goes after the CPU/RAM cost of re-indexing and the rework caused by lossy compression. Do not listen to only one side.
My position: ① and ④ unconditionally (CLAUDE.md diet and session hygiene — zero failure modes); ② rtk yes, but memorise the escape hatch; ③ caveman depends on your context shape, and I skipped it; and the two largest holes — document flooding and subagent fan-out — are beyond any tool. Those take architecture, and your own eyes on the attribution panel.
My current setup, and where it stops
Plainly: I did not adopt this wholesale, and I did not reject it wholesale. After one full pass, here is what I kept and what I dropped:
| What I do | Why | |
|---|---|---|
| CLAUDE.md diet | ✅ unconditional | 30.5k → 13.6k tokens/session. Zero failure modes, nothing to install. |
| rtk | ✅ wire the hook, memorise rtk proxy | Measured 32.2%. Debugging needs raw output. |
| codegraph | ✅ on | The daemon has a watcher; the stale window is 300 idle seconds. Reasonable, not a landmine. |
| caveman | ⬜ skipped | Saves output but adds 1–1.5k input per turn. Bad trade for a long-context shape. |
| Large documents | 🔧 architecture, not tools | Convert once + thin index + Haiku scout. The blind spot. |
| Subagent fan-out | 🔧 change the calling habit | Read-only scouting drops to Haiku; heavy weapons only for genuinely independent tasks. |
| Parallel sessions | 🔧 change how you work | Four windows share one budget pool. No tool fixes this — queue instead. |
The single most valuable thing here is not any tool. It is the attribution panel. It is the only thing that tells you where the savings went — and if nobody is watching, the answer is always: the next expensive habit took them.
Next post brings the measurements from the on-demand architecture: how many tokens one endpoint integration actually costs once the 209-page spec is split into an index plus fragments, and what that 73% falls to once every read-only scout is demoted to Haiku.
Send me the keyword "TOKEN-BILL KIT" and I'll send the pack from this measurement: the /context + attribution-panel breakdown template, the five self-check commands for "is this tool a decoration," the CLAUDE.md → skill → notes three-layer split checklist, and the coverage matrix and on/off decision table above.
(Channels in the footer — X or email both work.)
Building an agent right now?
Send me your worst conversation. Free failure teardown.
Comments
Subscribe
Get the next essay in your inbox.